The AEO/GEO tool category has matured. A handful of platforms now cover the same core job: running prompts against the major AI models, tracking mentions and citations, and reporting share of voice against competitors. Where the tools diverge is pricing, model coverage on base plans, and whether API access and team collaboration are included or gated to Enterprise.
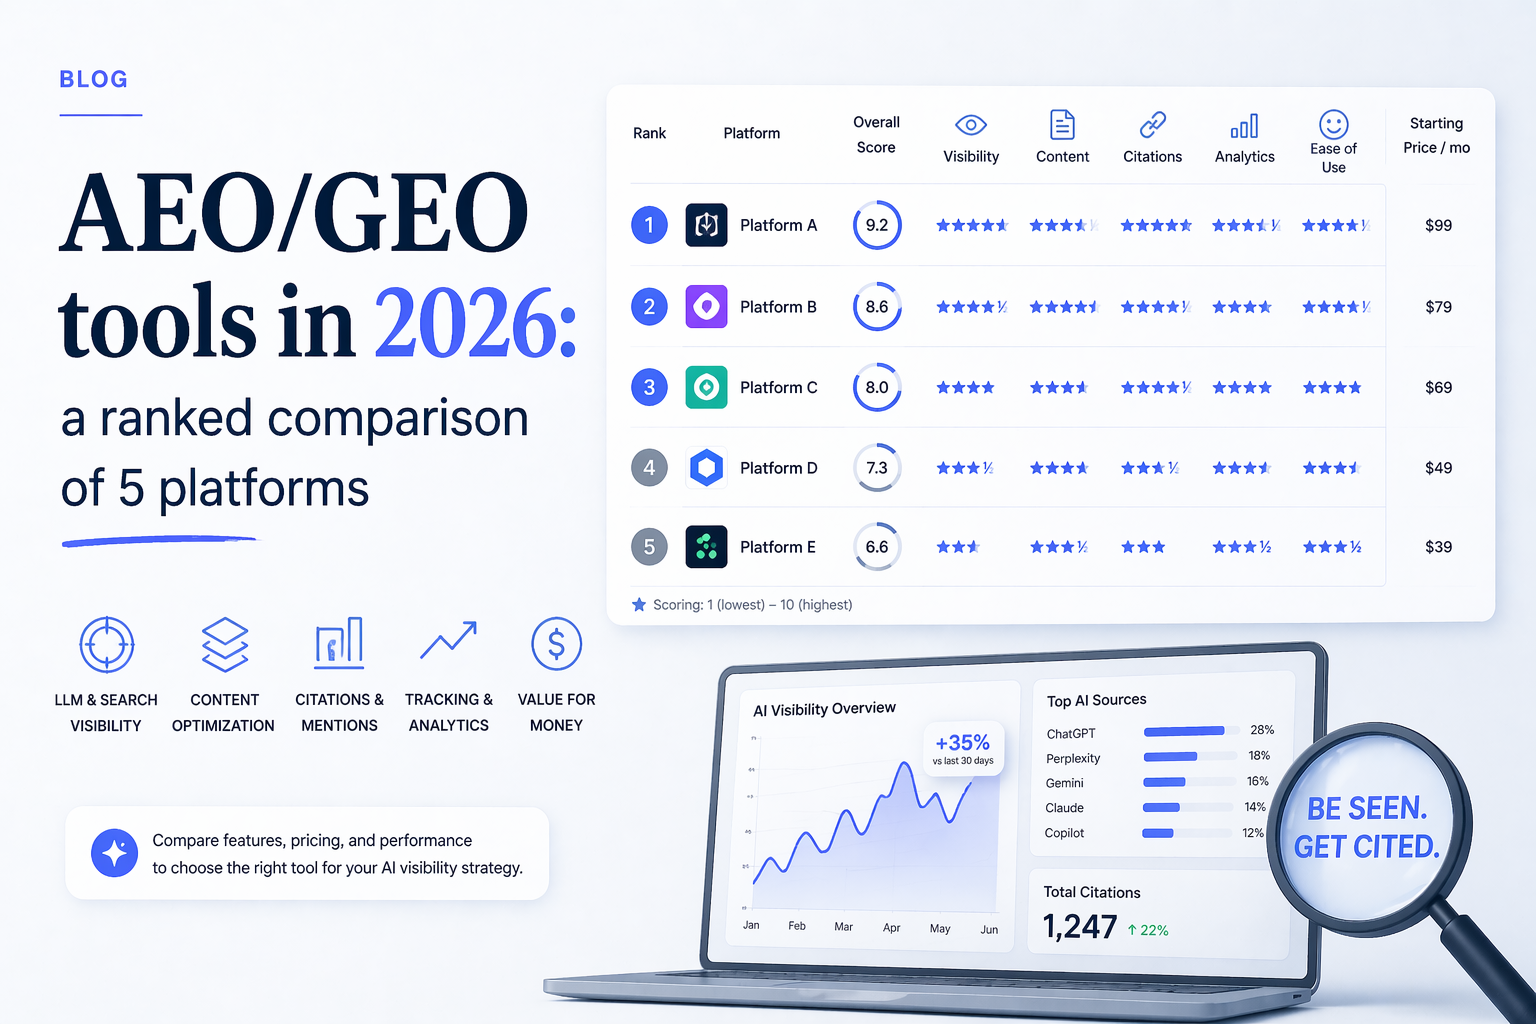
This is a ranked comparison of five AEO/GEO platforms (Profound, Peec AI, Scrunch AI, PromptWatch, Passionfruit) against Bourd. It also names six more we evaluated but didn’t include in the deep section, and explains why.
Written by the Bourd team. Bourd is one of the tools compared. Pricing and feature data comes from each vendor’s public pages and is verified monthly. Where Bourd has real trade-offs against a competitor, we say so.
Our pick: Bourd
Bourd wins on the six criteria below: pricing transparency, model coverage on base plans, unlimited seats, API and MCP access on every plan, compliance posture, and published methodology. It does not win on everything. If you need content templates with automatic CMS publishing, Profound is better. If your use case is ChatGPT Shopping analytics, PromptWatch is better. If you need 20 prompts tracked for one brand and price is the only constraint, Passionfruit Lite at $19/mo is cheaper than any serious plan, including Bourd’s.
For everyone else (marketing teams, agencies running AEO across a book of clients, in-house SEO leads adding LLM visibility to their remit), Bourd is our recommendation. The rest of this article shows the math.
| Tool | Entry price | Models on base | Unlimited seats | API on base | Verdict |
|---|
| Bourd | $69/mo | 8 | Yes | Yes | Our pick. Every feature on every plan. |
| Profound | $99/mo | 1 (ChatGPT) | Yes | No (Enterprise only) | Strong product. Workspaces, full model coverage, and API gated to Enterprise. |
| Peec AI | $95/mo | Pick 3 of 7 | Yes | No (Advanced+) | Each extra Model Provider $35–$165/mo. |
| Scrunch AI | $250/mo | 4 (Core) | No ($25/extra seat) | No (Enterprise only) | Premium positioning, per-seat fees beyond tier caps. |
| PromptWatch | $99/mo | 8 | No (per-seat) | No (Professional+) | Same models as Bourd. Per-seat pricing punishes teams. |
| Passionfruit | $19/mo | 1 (ChatGPT at Lite) | Yes | No (none on any tier) | Lowest entry price. T&Cs allow pricing changes at any time. |
Pricing last verified April 2026.
How we scored
Six criteria, each one a real buyer decision:
- Pricing transparency. Public price, no sales call required, per-action cost visible in the product before it runs.
- Model coverage on the base plan. How many of the nine major Model Providers (ChatGPT, Claude, Gemini, Perplexity, Grok, DeepSeek, Meta AI, Google AI Mode, Google AI Overviews) are tracked on the lowest paid tier.
- Collaboration pricing. Per-seat, per-workspace, or unlimited. Whether adding a brand, a client, or a teammate changes the bill.
- API and MCP access on non-Enterprise tiers. Can you pull data into your existing reporting, or is programmatic access gated behind a sales conversation? We argue this is the single most important feature separating serious AEO tools from glorified dashboards.
- Compliance posture. SSO and custom roles available on non-Enterprise plans, or reserved for the top tier.
- Methodology transparency. Does the vendor publish which prompts they run, how citations are counted, and how they handle new model releases?
These are the six questions that separate a working AEO tool from a dashboard you’ll replace in 12 months.
Profound
Strong product, built for lock-in. Workspaces, full model coverage, and the API are Enterprise-gated.
Profound is the best-funded tool in this comparison (Series C, $96M raised). The product is polished, the content-template and auto-publish features are genuinely useful, and ChatGPT Shopping integration is mature. The commercial model is the problem: most of what the tool actually does sits behind the Enterprise tier.
Pricing
| Plan | Price | Prompts | Models | Notes |
|---|
| Starter | $99/mo | 50 | ChatGPT only | Single brand |
| Growth | $399/mo | 100 | 3 models | 3 brands |
| Enterprise | Custom (est. $3–4k/mo) | Custom | All | Full model coverage starts here |
What Profound does well
- Content templates and automatic CMS publishing. No other tool in this list has this built in.
- Workflow automation inside the product, not as a bolt-on.
- ChatGPT Shopping integration for e-commerce brands.
- Brand sentiment and citation tracking across models (on higher tiers).
Where it falls short
- Workspaces are Enterprise-only (G2 reviews).
- Starter is ChatGPT-only. You pay $99/mo to track one model. Growth ($399) adds Perplexity and Google AI Overviews.
- API access is Enterprise-only ($2k–$5k+/mo).
- Prompt tiers are fixed at 50 or 100. No middle ground.
- Complex onboarding reported consistently (G2 reviews).
- Performance issues reported (SourceForge).
Choose Profound if
Content templates and auto-publishing into your CMS are the reason you’re buying the tool, you have Enterprise budget, and you’re willing to book a call to access the core features.
Choose Bourd if
You want workspaces and all nine Model Providers on every plan, without an Enterprise conversation. Full comparison: Bourd vs Profound →
Peec AI
Looker Studio connector. Pick three Model Providers per plan. Each extra costs $35–$165/mo.
Peec is BI-friendly. If your team already reports out of Looker Studio, the native connector is a real fit. The trade-off is per-Provider pricing: every base plan lets you choose 3 Model Providers from a catalog of 7 (ChatGPT, Perplexity, Gemini, Google AI Overviews, Google AI Mode, Microsoft Copilot, Grok). Each additional Model Provider costs $35 on Starter, $85 on Pro, or $165 on Advanced — per month, per Provider. Claude is not in Peec’s catalog. Peec and Bourd have the two most mature MCP platforms out of all products compared.
Pricing
| Plan | Price | Prompts | Models | Notes |
|---|
| Starter | $95/mo | 50 | Pick 3 of 7 | $35/mo per extra Model Provider |
| Pro | $245/mo | 150 | Pick 3 of 7 | $85/mo per extra Model Provider |
| Advanced | $495/mo | 350 | Pick 3 of 7 | $165/mo per extra Model Provider; API unlocks here |
| Enterprise | Custom | Custom | Negotiable | n/a |
What Peec does well
- Excellent MCP Server support on all plans.
- Native Looker Studio integration (Advanced+). The only tool in this comparison with it.
- Prompt-level insights and data exports on all plans.
- Unlimited seats on all paid tiers.
- Content recommendations tied to specific prompts.
Where it falls short
- API access gated to Advanced ($495/mo) and Enterprise (Peec pricing).
- Missing SSO on lower tiers (G2 reviews).
- Per-Provider add-on pricing: matching Peec’s full 7-Provider catalog on Pro adds $340/mo in add-on fees on top of the $245 base.
- Claude is not supported on any tier.
- No actionable guidance tied to ROI (Scalenut review).
Choose Peec AI if
You’re reporting out of Looker Studio, and three of the seven Model Providers in Peec’s catalog cover the buyers you care about.
Choose Bourd if
You want all nine Model Providers on the lowest paid tier and a public API you don’t have to negotiate for. Full comparison: Bourd vs Peec →
Scrunch AI
One of the earliest AEO entrants. Product velocity hasn’t matched.
Scrunch was one of the first tools in the category and raised an early venture round on that head start. The pricing still reflects the early-mover positioning: $250 to start for one brand and four Model Providers, $25 per additional seat above the cap, and API access only on Enterprise. The product itself has been slower to evolve than competitors that shipped later. Coverage is narrow for the price.
Pricing
| Plan | Price | Prompts | Seats | Brands | Notes |
|---|
| Core | $250/mo | 125 | 5 | 1 | $25/extra seat (or $75/5-pack); 4 Model Providers |
| Agency Core | $500/mo | 250 | Unlimited | Unlimited | Still 4 Model Providers |
| Enterprise | Custom | Custom | Unlimited | Unlimited | API and remaining 5 Model Providers start here |
What Scrunch does well
- Microsoft Copilot tracking on Core (most competitors don’t cover Copilot at all on lower tiers).
- Bundled page audits and persona features for teams who specifically want them tied to AEO tracking.
Where it falls short
- Entry price is $100+ above tools with equivalent coverage.
- Core covers only 4 Model Providers (ChatGPT, Perplexity, Google AI Overviews, Microsoft Copilot). Claude, Gemini, Grok, Meta AI, and DeepSeek all require Enterprise.
- API access is Enterprise-only.
- $25 per additional seat above the 5-seat Core cap.
- Interface and feature shipping cadence feel behind newer entrants (G2 reviews).
- Pricing scales quickly beyond the Core tier (G2 reviews).
- AI Search trend data is presented as analysis but isn’t sourced from public data — directionally useful at best.
Choose Scrunch AI if
You specifically need Microsoft Copilot tracking on a base plan, your prompt volume sits inside the 125-prompt Core limit, and four-Provider coverage is enough.
Choose Bourd if
You want the lower entry price and API access without an Enterprise conversation. Full comparison: Bourd vs Scrunch →
PromptWatch
Eight of Bourd’s nine Model Providers (missing Google AI Overviews). Per-seat pricing and extra fees for brands. API starts at Professional.
PromptWatch is the closest to Bourd on model coverage: all eight of its Model Providers on every plan, missing only Google AI Overviews from Bourd’s set. The difference is how the plans are billed. Per-seat pricing with low prompt caps and per-brand fees means the bill grows with the team, not with usage. API access is excluded from the Essential tier.
Pricing
| Plan | Price | Prompts | Seats | Brands |
|---|
| Essential | $99/mo | 50 | 1 | 1 |
| Professional | $249/mo | 150 | 2 | 2 |
| Business | $579/mo | 350 | 5 | 5 |
| Enterprise | Custom | Custom | Unlimited | Unlimited |
What PromptWatch does well
- All eight of PromptWatch’s supported Model Providers on every plan.
- ChatGPT Shopping analytics. A real differentiator for e-commerce.
- API access on Professional and above.
- Multi-modal coverage including Reddit and YouTube.
Where it falls short
- Per-seat pricing scales poorly for growing teams.
- Additional brands and seats cost extra.
- API access excluded on Essential ($99); starts at Professional ($249).
- UX described as hard to use (Ignite Marketing review).
- Limited content optimization guidance (Reddit r/DigitalMarketing).
- Interface feels dated compared to alternatives (Reddit r/LLMVisibility).
Choose PromptWatch if
You need ChatGPT Shopping analytics, and your team is small enough that per-seat pricing and a three-brand cap aren’t constraints.
Choose Bourd if
You want unlimited seats, unlimited brands, and one more Model Provider than PromptWatch (Google AI Overviews) from day one. Full comparison: Bourd vs PromptWatch →
Passionfruit
$19/mo entry. Run by a digital agency as lead generation. No API or MCP. T&Cs allow pricing changes at any time.
Passionfruit is a loss-leader product. The parent company is a digital services agency; the tool exists primarily to generate leads for the consulting arm. That framing shows up in the product itself: limited Model Provider coverage on self-serve, no programmatic access on any tier, and basic insights without optimization recommendations. It’s positioned for solo operators who want a starter dashboard, not for teams running AEO as a measurement function.
Pricing
| Plan | Price | Prompts | Models |
|---|
| Lite | $19/mo | 20 | ChatGPT only |
| Starter | $49/mo | 70 | 3 (adds Gemini, Perplexity) |
| Pro | $99/mo | 150 | 4 (adds Claude) |
| Enterprise | Custom | Custom | 9 (adds Grok, DeepSeek, Meta AI, Copilot, AI Overviews) |
What Passionfruit does well
- $19/mo entry. The cheapest tool in the category, with the limits to match.
- Unlimited seats, even on Lite.
- Covers ChatGPT, Gemini, Perplexity, and Claude by Pro tier.
Where it falls short
- Four Model Providers maximum on self-serve. Grok, DeepSeek, Meta AI, Copilot, and AI Overviews all require Enterprise (custom-quoted, sales call).
- No public API or MCP server documented on any tier, including Enterprise. Programmatic access and AI-agent integrations aren’t available.
- Starter and Pro plans appear priced below cost, likely subsidized by the parent agency’s consulting revenue.
- Terms of service reserve the right to change pricing or usage limits at any time (Passionfruit T&Cs).
- Basic insights only. No optimization recommendations.
- 7-day trial requires a credit card.
Choose Passionfruit if
You need to track 20 prompts for one brand, price is the only constraint, and you accept the risk of pricing changes mid-contract.
Choose Bourd if
You want nine Model Providers from day one, API and MCP access (Passionfruit has neither on any tier), and no “we can change pricing whenever we want” clause in the T&Cs. Full comparison: Bourd vs Passionfruit →
Bourd
Every feature on every plan. Nine Model Providers, API, MCP, SSO, unlimited seats. Credit-based pricing.
Bourd is the intelligence layer, not the editorial workflow. Sharp focus on measurement: mentions, citations, sentiment, share of voice over time, and specific content gaps where competitors get cited and you don’t. Then open access via API and MCP, so teams build their own workflows in the tools they already use.
Pricing
| Plan | Price | Credits | Typical prompts | Notes |
|---|
| Starter | $69/mo | 25,000 | ~70 | All nine Model Providers, full feature set |
| Growth | $149/mo | 75,000 | ~200 | Featured plan |
| Pro | $1,099/mo | 750,000 | ~2,000 | Agencies and multi-brand books |
Top-ups run $1.30–$2.00 per 1,000 credits depending on tier, with 12-month carry-over. 1,000 free credits on signup, no card. 14-day refund.
What Bourd does well
- All nine major Model Providers (ChatGPT, Claude, Gemini, Perplexity, Grok, DeepSeek, Meta AI, Google AI Mode, Google AI Overviews) on the Starter plan.
- API and MCP server on every plan. No Enterprise gate for programmatic access. Real workflows others have built are catalogued at /mcp/use-cases.
- Unlimited users, workspaces, and brands on every plan.
- Credits map directly to LLM token cost. Every action shows its credit cost before it runs.
- Public pricing. No sales call to see the number.
- Annual third-party pen testing.
- Multi-account membership for agencies. Same operator moves between agency-owned and client-owned accounts with one login.
Where Bourd falls short
Honest trade-offs, not softened:
- No content auto-publishing into your CMS. Profound does this; Bourd doesn’t.
- No ChatGPT Shopping analytics. PromptWatch owns that surface.
- No Looker Studio connector. Peec AI has this native.
- No integrated consulting services. Passionfruit bundles agency services; Bourd sells the tool only.
- No SOC 2 certification. Annual third-party pen testing is in place, but SOC 2 is not on the current roadmap. If SOC 2 is a hard procurement requirement, Bourd isn’t the right fit today.
If you want the AEO tool to also be the editorial workflow and the CMS publishing layer, Bourd is not the right pick.
Choose Bourd if
You want measurement, API access, and unlimited collaboration without the Enterprise negotiation.
See pricing → · Try Bourd free (1,000 credits, no card) →
Also considered
A few more AEO/GEO tools we’ve evaluated but held back from the deep section to keep this post focused:
- Otterly AI, Goodie AI, Rankscale AI, AthenaHQ, Gauge, Writesonic GEO. Full head-to-heads coming in follow-up posts. Omitted here for brevity, not signal.
- Ahrefs AEO, Semrush AEO modules. Broader SEO suites adding AEO features. Thinner on citation and prompt-level data than specialized tools. Reasonable if AEO is a small part of a bigger SEO job.
Five questions to ask any AEO vendor
Put these in the vendor conversation. Ask for evidence, not claims.
1. How do you validate the accuracy of your visibility tracking?
- Looking for: a reproducible test suite, published methodology, and raw response data you can spot-check against a manual query.
- Red flag: “proprietary algorithm.”
- Bourd’s answer: We run the same prompts you see in the UI, against each model’s official API where available. Raw responses are inspectable on every tracked prompt.
2. What’s your data source: official API or front-end scraping?
- Looking for: a clear answer and an explanation of the trade-offs.
- Red flag: evasion or “it’s a mix.”
- Bourd’s answer: Official API where available (OpenAI, Anthropic, Google, xAI, Perplexity, DeepSeek, Meta). Model names and versions are specific and visible on every response.
3. What’s your process for supporting new AI model releases?
- Looking for: a public changelog with dates, not promises.
- Red flag: “we adapt as needed.”
- Bourd’s answer: Opus 4.7 and Grok 4.20 were added the week they shipped. Our public changelog carries the dates.
4. How do you measure ROI beyond citation counts?
- Looking for: data that connects to conversions, lead quality, or pipeline. Not only visibility mentions.
- Red flag: “ROI is hard to measure directly.”
- Bourd’s answer: Mentions, citations, sentiment, share of voice vs. named competitors, and specific content gaps: the prompts where competitors get cited and you don’t. API access pipes this into your existing attribution model.
5. How do I control query volume and cost?
- Looking for: adjustable cadence, visible per-prompt cost, the ability to pause.
- Red flag: “more data is always better.”
- Bourd’s answer: Credits are tied directly to LLM token cost. Every action shows its credit cost before it runs. Schedule frequency is under your control.
FAQ
Which AEO/GEO tool is cheapest?
Passionfruit Lite at $19/mo. It tracks 20 prompts against ChatGPT only and is operated by a digital agency as a lead-generation product. For anything beyond a single brand with minimal coverage, Bourd’s Starter plan at $69/mo covers nine Model Providers and is the cheapest serious option.
Which AEO tools offer API access on base plans?
Bourd is the only tool in this comparison with API access on its lowest paid tier. PromptWatch gates API to Professional ($249). Peec AI gates API to Advanced ($495) and Enterprise. Profound and Scrunch AI gate API access to Enterprise. Passionfruit does not document a public API on any tier.
Which AEO tools track all nine major Model Providers?
Bourd tracks ChatGPT, Claude, Gemini, Perplexity, Grok, DeepSeek, Meta AI, Google AI Mode, and Google AI Overviews on the lowest paid tier. PromptWatch covers the same set minus Google AI Overviews (eight Model Providers on every plan). Profound covers seven only on Enterprise (no Google AI Mode). Peec AI lets you pick 3 from a catalog of 7 (ChatGPT, Perplexity, Gemini, AI Overviews, AI Mode, Copilot, Grok) and bills $35–$165/mo for each extra; Claude is not in their catalog. Scrunch AI Core covers four. Passionfruit covers four on self-serve (Pro adds Claude); the remaining Model Providers are Enterprise only.
What’s the difference between AEO and GEO?
Both describe the same work: optimizing content so that brands are accurately cited by AI-generated answers. AEO (Answer Engine Optimization) is more common in SEO circles; GEO (Generative Engine Optimization) is more common among marketing agencies. The underlying task is the same: tracking how a brand is cited by LLMs, finding content gaps where competitors win citations, and producing content that models source accurately.
Do I need a dedicated AEO tool, or can my SEO platform handle it?
Ahrefs and Semrush have added AEO modules. They are broader and shallower than dedicated AEO tools: fewer prompts tracked, weaker citation parsing, less model coverage. For a team running an SEO suite and adding AEO as a small part of the job, the module may be sufficient. For teams where AEO is a primary measurement surface, a dedicated tool produces more useful data.
How often do AEO tools need to update for new AI model releases?
Major model releases ship on a cadence of months: GPT-5, Claude Sonnet 4.6, Gemini 3, Grok 4.20, and Opus 4.7 all landed in the last 12 months. Tools that take weeks to add support are signaling how much engineering attention the product gets. Look for a public changelog with dated entries.
The bottom line
- Best overall: Bourd. Every feature on every plan, nine Model Providers, API and MCP included, public pricing.
- Best if you need content auto-publishing: Profound.
- Best if you already report out of Looker Studio: Peec AI.
- Best for ChatGPT Shopping analytics: PromptWatch.
- Cheapest for one brand and 20 prompts: Passionfruit Lite.
If you want to try Bourd, there are 1,000 free credits on signup, no card required. Get started → · See pricing → · Bourd MCP →
Last updated April 22, 2026. Pricing verified against each vendor’s public pages at time of writing. We refresh this comparison quarterly; if a vendor on this list has changed pricing and we haven’t caught it, let us know.